Policies related to resource use and circular economy
Gunvor has documented its policies and expectations in relation to Health, Safety, Environment, Human Rights and Communities in a formal document called “Group HSEC Policy”. Our policy in relation to resource use and circular economy is covered in the environment section. We refer to the MDR-P (p.30) section of this report for further details.
In relation to the use of fossil resources you may refer to the section on climate change in this report.
E5-2This is small tooltip textActions and resources in relation to resource use and circular economy
Gunvor contributes to a circular economy by means of our two biodiesel plants, where we convert a waste stream (used cooking oil) into a low carbon fuel (biodiesel).
At our other operations the focus is on the reduction of energy use and GHG reduction. Indirectly this leads to a reduced use of natural resources (fossil energy).
E5-3This is small tooltip textTargets related to resource use and circular economy
Gunvor started the internal reporting of the waste percentage that is being recycled in 2023. When we have developed longer time ranges and more experience with this metric, we may consider using this for setting certain targets.
As explained above, the Group focuses our targets on the reduction of energy use and GHG emissions.
E5-4This is small tooltip textE5-4 Resource inflows
Gunvor’s trading activities comprise large quantities of resources such as oil, gas, metals. Inherent to trading activity, the inflow equals the outflow in the longer term, without use by the Company.
Regarding its operational activities we limit ourselves here to a qualitative description of the significant resource inflows. For refining these are mainly crude oil and natural gas. The biodiesel plants use vegetable oils, mainly used cooking oil, to produce biodiesel. The recently acquired plant in Bilbao (BBE) uses natural gas to produce electricity.
Resource outflows
The graph provides information on the waste quantities in the recent years. The quantities vary considerably. Soil remediation and demolition projects generate significant quantities. These factors explain the variation of waste quantities, and as much as Gunvor develops approaches to minimize and optimize waste generation, some quantities are unavoidable. Gunvor’s waste management is focused on separation into various types of waste and selecting the appropriate destination for each category with the help of specialized contractors. This work is heavily regulated to protect the environment, and all waste is transported to licensed waste-processing sites.
Yearly waste quantities
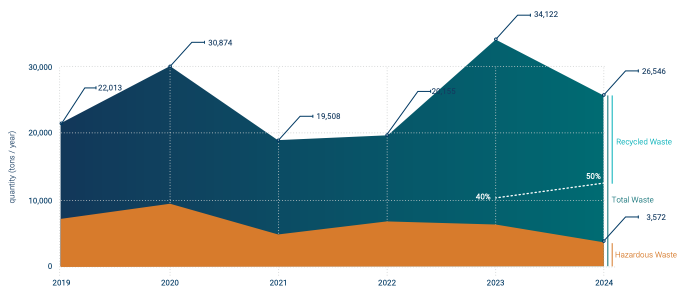
About this graph: The total quantities of total waste and hazardous waste decreased in 2024 compared to 2023.
In 2023 the percentage recyclable waste was 40%. In 2024 this percentage increased to 50%. The recyclability is dependent on the types of waste. For example, contaminated soil from remediation projects can be cleaned and reused only if there is no residual contamination. Otherwise, it needs to go to a landfill site.